Last week’s hot spell over large parts of Europe may have triggered memories of the heatwaves in the summers of 2003 and 2006. Over a number of days many European cities recorded peak temperatures in the year thus far, including Madrid (39.9 °C), Paris (39.7 °C), Berlin (37.9 °C) and London-Heathrow (36.7 °C). While definitions may vary somewhat regionally, a heatwave is generally described as a period of a number of consecutive days when the daily maximum temperature exceeds the average maximum temperature or a set maximum temperature by a set number of degrees. According to the World Meteorological Organization a heatwave occurs “when the daily maximum temperature of more than five consecutive days exceeds the average by 5 °C, the normal being 1961-1990.” If last week’s weather conditions signaled the start of a period of drought in Europe, however, is yet another story.
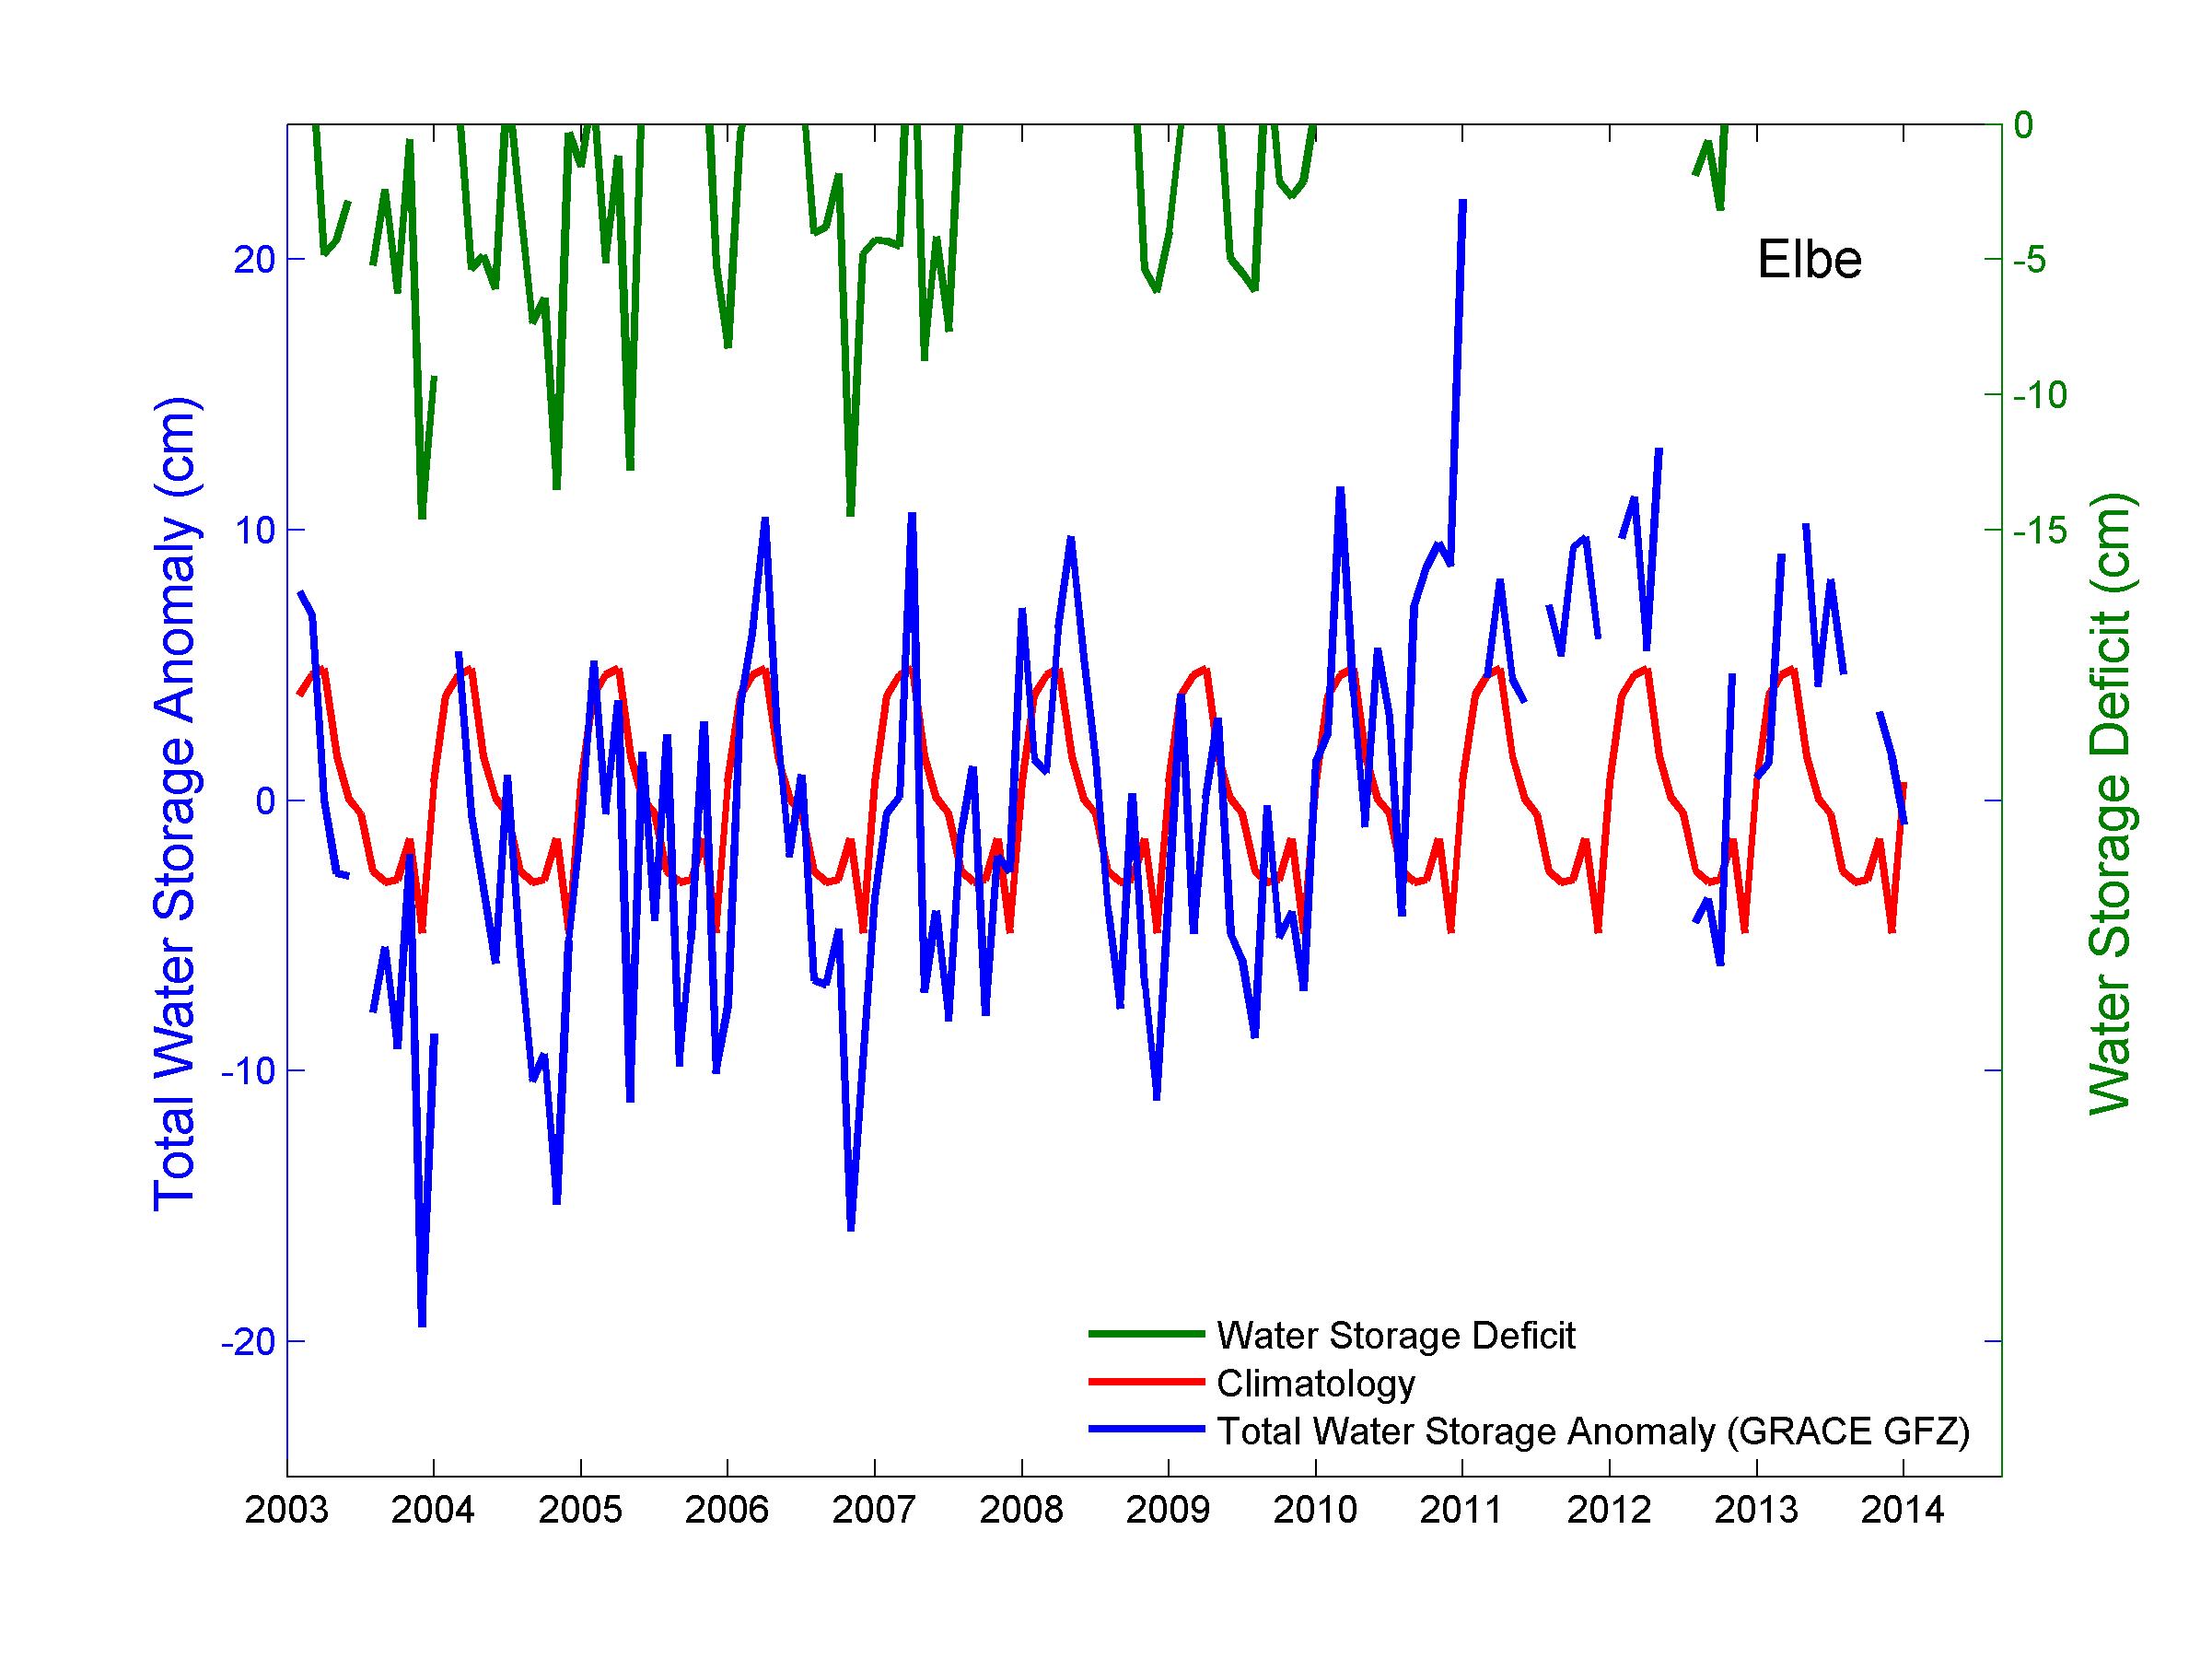
Drought means different things to different people. This is partly explained by the fact it affects every component of the hydrological cycle (precipitation, soil moisture, evaporation, streamflow or groundwater). As a result, many drought indices have been developed over the years using different variables for different types of drought, including meteorological (precipitation), agricultural (soil moisture) and hydrological (streamflow or groundwater). Near-surface wetness conditions change rapidly with the weather, which makes them suitable to detect the onset of a drought early on. Deeper stores of water, including root zone soil moisture and groundwater have significant “memory”, and are therefore appropriate to describe drought persistence. Variations of water stored at all levels above and within the land surface are provided by the GRACE satellite mission since its launch in 2002, but the potential to use this information for drought monitoring and forecasting has not yet been explored extensively. Figure 1 shows monthly GRACE-derived Total Water Storage Anomaly (TWSA, blue line) values for the Elbe river basin in Germany, as provided by the GFZ German Research Centre for Geosciences, Potsdam, Germany (GFZ RL05a DDK5).

Figure 1 – GRACE-observed water storage anomalies and deficits for the Elbe river basin. Blue line: spatial average storage anomaly, red line: monthly climatology, and green line: water storage deficit.
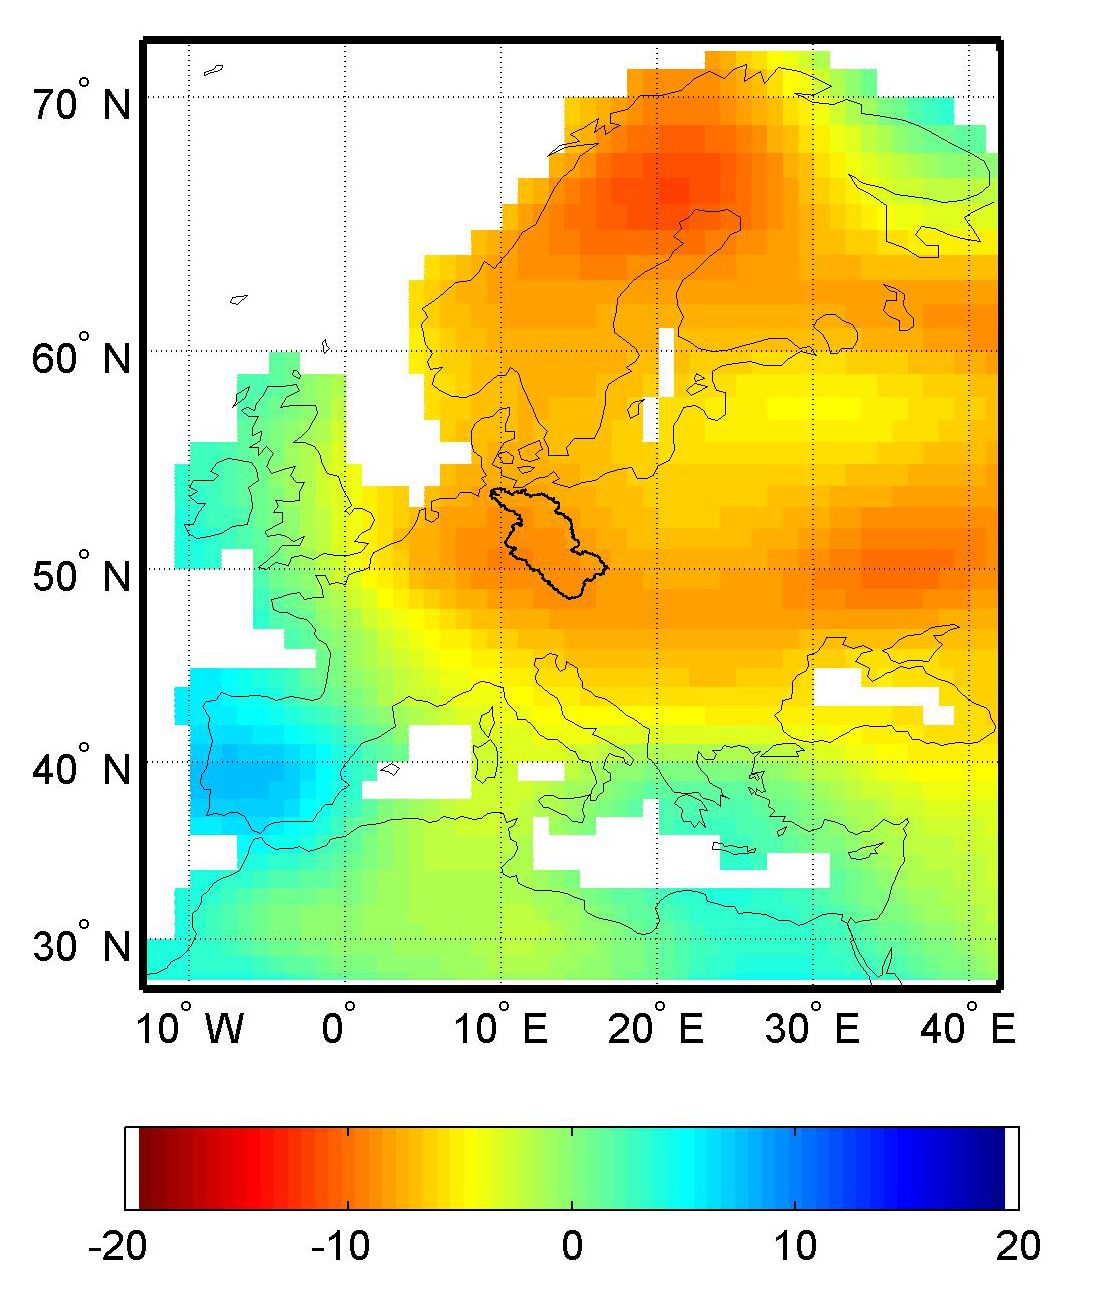
Following Thomas et al. (2014), a 10-year climatology is calculated by averaging the TWSA values of each month (red line). Water storage deficits are computed as the negative residuals after subtracting the 10-year climatology from the GRACE TWSA time series. The monthly water storage deficit represents relatively dry conditions, of which, as a low pass filter, only instances of water deficits of three months or more are shown (negative residuals, green line). Peak water deficits in the Elbe river basin occur late in the years of recorded summer heatwaves (2003, 2006), which seems to suggest a delayed response of total water storage to weather conditions (Figure 2).

Figure 2 – Water storage variability for Europe for the month of November 2003 in terms of equivalent water heights (cm), highlighting minimum values in the Elbe river basin (mask)
The delayed response is possibly carried over to the ensuing ‘regular’ years (2004, 2005 and 2007, respectively). These years show dampened peak water deficits, which may reflect a long-term memory of the total water storage in the Elbe catchment. The EGSIEM project will continue to monitor the current conditions in Europe, as part of the hydrological service to develop indicators of the hydrological extremes of flood and drought.
Thomas, A. C., J. T. Reager, J. S. Famiglietti, and M. Rodell (2014), A GRACE-based water storage deficit approach for hydrological drought characterization, Geophys. Res. Lett., 41, 1537–1545, doi: 10.1002/2014GL059323.
